Tie Heatmaps to Revenue, Keep Consent for Analysts and Marketers

Heatmaps show you where visitors clicked, scrolled, and hovered, but they never tell you why. The correct workflow starts with a defined task, moves to segment-first sampling with enough data to be credible, then triangulates heatmap patterns against session replays and funnel reports before anyone touches the design. Skip that order and you optimize for noise.
TL;DR:
- Heatmaps must be combined with session replays and funnel reports to accurately interpret visitor behavior and avoid noise.
- A reliable heatmap sample size is around 30 users, and patterns should be consistent across days, segments, and devices before making decisions.
- Segmenting data by user task, device type, and traffic source before analysis reveals hidden behaviors and reduces aggregation bias.
- Formulating hypotheses before analyzing heatmaps and validating with funnels, replays, or A/B tests prevents misinterpretation and unnecessary changes.
- Heatmaps are best for confirming specific design changes quickly; for understanding motivations or high-stakes pages, deeper UX research is necessary.
Table of Contents
- Types of heatmaps and what each one actually measures
- Interpreting heatmaps: sample size, scanning patterns, and reliability
- Segmentation-first analysis and heatmap grids
- From insight to impact: prioritize fixes and tie heatmaps to conversions
- Common mistakes and pitfalls analysts make with heatmaps
- Practical implementation: choosing tools and handling privacy and consent
- Forefront Industries’ practitioner checklist and brief case evidence
- Practical perspective: when heatmaps are the right tool, and when to stop
- How Forefront Industries helps with heatmap-driven growth
- FAQ
- Sources
Types of heatmaps and what each one actually measures
Each heatmap type answers a narrow question. Treating them as interchangeable is where most misreads start.
- Click maps show where visitors clicked or tapped, useful for checking if a call-to-action gets noticed or if visitors click on non-interactive elements, a sign of a confusing layout.
- Scroll maps show how far down a page visitors travel, useful for confirming whether content below the fold gets seen at all.
- Move or hover maps track cursor movement as a rough proxy for visual attention, useful for spotting general areas of interest on a page.
- Attention or revenue heatmaps weight interactions by business value, useful for ranking which page zones correlate with completed purchases or leads.
- Session replays record individual visitor sessions, useful for watching the exact sequence of actions behind a confusing heatmap signal.
Each type has a blind spot. Move maps are not eye-tracking data: cursor position and gaze frequently diverge. Scroll maps compress long pages into a single gradient, which hides where engagement actually drops. The fix is never a single map type on its own. Pair the aggregate pattern with a handful of replays before drawing conclusions.
Interpreting heatmaps: sample size, scanning patterns, and reliability
Color gradients on a heatmap are relative, not absolute. A warm red zone means high concentration relative to the rest of that specific dataset, not a fixed number of clicks or a guaranteed share of traffic. Reading a heatmap as if red meant “most users” is the fastest way to chase a false signal.
Nielsen Norman Group recommends roughly 30 participants to produce a heatmap pattern that reflects real behavior rather than the habits of two or three outlier visitors. Below that threshold, a single heavy clicker can paint an entire zone red.
Scanning behavior also shapes what you see. Eyetracking research from Nielsen Norman Group identifies four scanning patterns: F-pattern, spotted, layer-cake, and commitment. The same page produces different heatmaps depending on which pattern the user’s task triggers, so a map read without knowing the task is a map read blind.
Before trusting a pattern, run these checks:
- Does the pattern repeat across multiple days and traffic sources, or does it only appear in one short window?
- Does the same hot zone show up across different segments, or only in one device type?
- Does a colder zone correspond to content people are actually reading, rather than content they are ignoring?
Segmentation-first analysis and heatmap grids
Aggregated heatmaps average away the behavior differences that matter most. A pattern that looks clear on a blended desktop-and-mobile map can disappear, or reverse, once you split the data.
Before opening any heatmap, define:
- The specific user task the page is meant to support, such as completing checkout or requesting a quote.
- The segments most likely to behave differently: device type, traffic source, logged-in status, and landing page.
- The comparison you expect to see, written down before you look.
Arrange these segments side by side as a grid rather than switching between single views. A grid makes contrasts visible immediately: mobile visitors abandoning a form field that desktop visitors skip past, or paid traffic ignoring a navigation element that organic visitors use constantly.
Pro Tip: Build your segment grid before the test launches, not after you spot something odd. Reacting to a single surprising map almost always leads you toward confirmation bias.
From insight to impact: prioritize fixes and tie heatmaps to conversions
Heatmaps earn their value when they feed a decision, not when they get admired. Write your hypothesis before you open the data: what you expect to see, and what change you would make if you are right. Log it. That single habit is the strongest guard against reading intent into random noise, a point Nielsen Norman Group’s heatmap guidance makes directly: record the hypothesis first, then check whether the data supports or contradicts it.
Before changing any interface, triangulate the heatmap against:
- Funnel reports, to confirm the step where visitors actually drop off.
- Form analytics, to see which specific fields cause hesitation or abandonment.
- Session replays, to watch the real sequence behind an ambiguous click pattern.
Baymard Institute’s research guidance puts it plainly: heatmaps show what is happening, rarely why, so pairing them with UX research is how you find the cause instead of guessing at it.
Rank fixes by estimated impact on revenue or lead quality rather than by click volume alone. A low-traffic page with a broken form costs more than a high-traffic page with a slightly ignored banner.
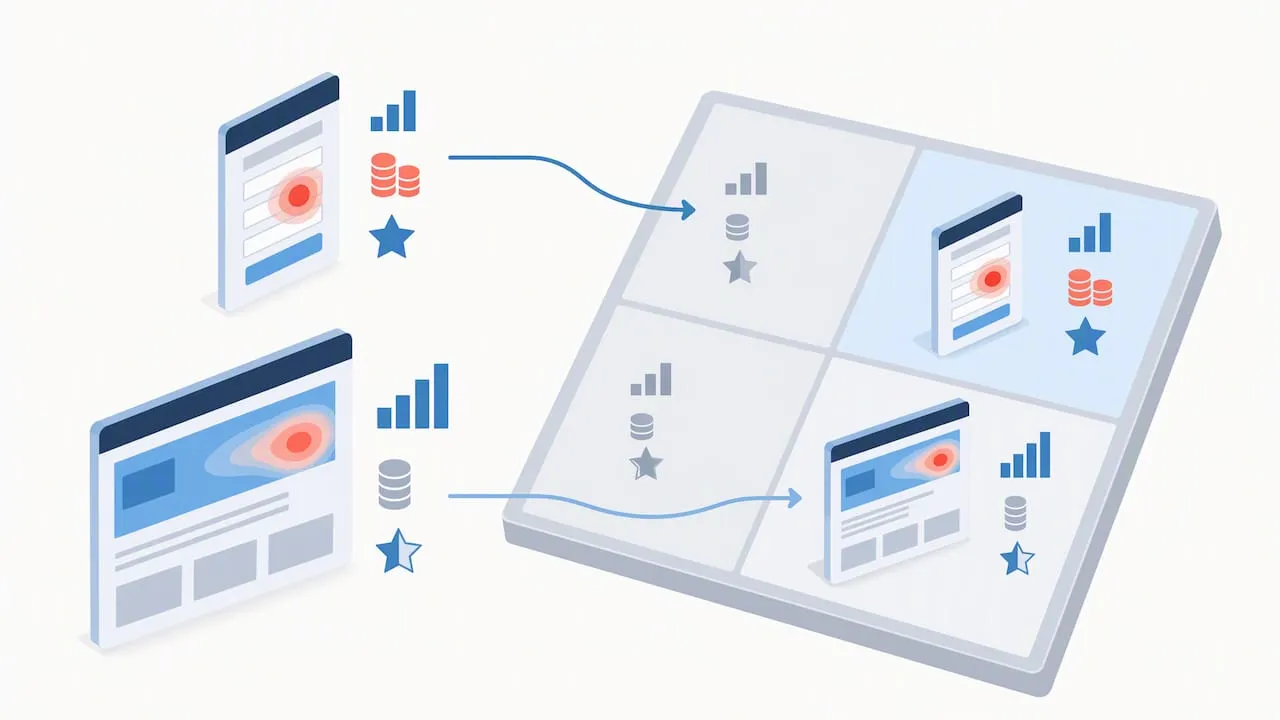
Pro Tip: Triage first for rage clicks, phantom clicks on dead elements, calls-to-action sitting below the typical scroll depth, and buttons that look clickable but are not. These four patterns carry the least ambiguity and the fastest payoff.
Common mistakes and pitfalls analysts make with heatmaps
Most heatmap mistakes come from reading too much certainty into too little data.
- Over-interpreting a small sample: a hot zone built from a handful of sessions reflects individual habits, not general behavior. Wait for enough volume before acting.
- Assuming cursor position equals eye gaze: visitors often hold the cursor still while reading, which can make actively read content look cold. Cross-check with replays.
- Aggregating devices into one map: mobile and desktop behavior differ enough that a blended view hides the real pattern. Always segment first.
- Acting on a heatmap without A/B validation: a heatmap suggests a hypothesis, it does not prove a fix works. Test the change before rolling it out everywhere.
Keep a short log of each hypothesis and its outcome. That record is what keeps future analysis honest instead of chasing whatever looks interesting that week.
Practical implementation: choosing tools and handling privacy and consent
Choosing a heatmap tool comes down to a few practical criteria: sampling transparency so you know your real sample size, segmentation depth, replay integration, support for revenue-weighted views, and reasonable data retention and export options.
Before launch, work through this checklist:
- Place the tracking snippet correctly and confirm it fires only after consent is granted where required.
- Configure consent states for advertising and analytics storage before collecting any heatmap data.
- Set a defined sampling window long enough to reach a credible participant count.
- QA session replay accuracy against a few known user paths to catch tracking gaps early.
Google’s Consent Mode v2 documentation outlines the states you need to configure, including ad_storage, analytics_storage, and ad_user_data, along with URL passthrough as a fallback that preserves measurement when storage is denied. Document which consent configuration and sampling window were active for each dataset. Without that record, you cannot tell whether a shift in the heatmap came from user behavior or from a tracking change.
Forefront Industries’ practitioner checklist and brief case evidence
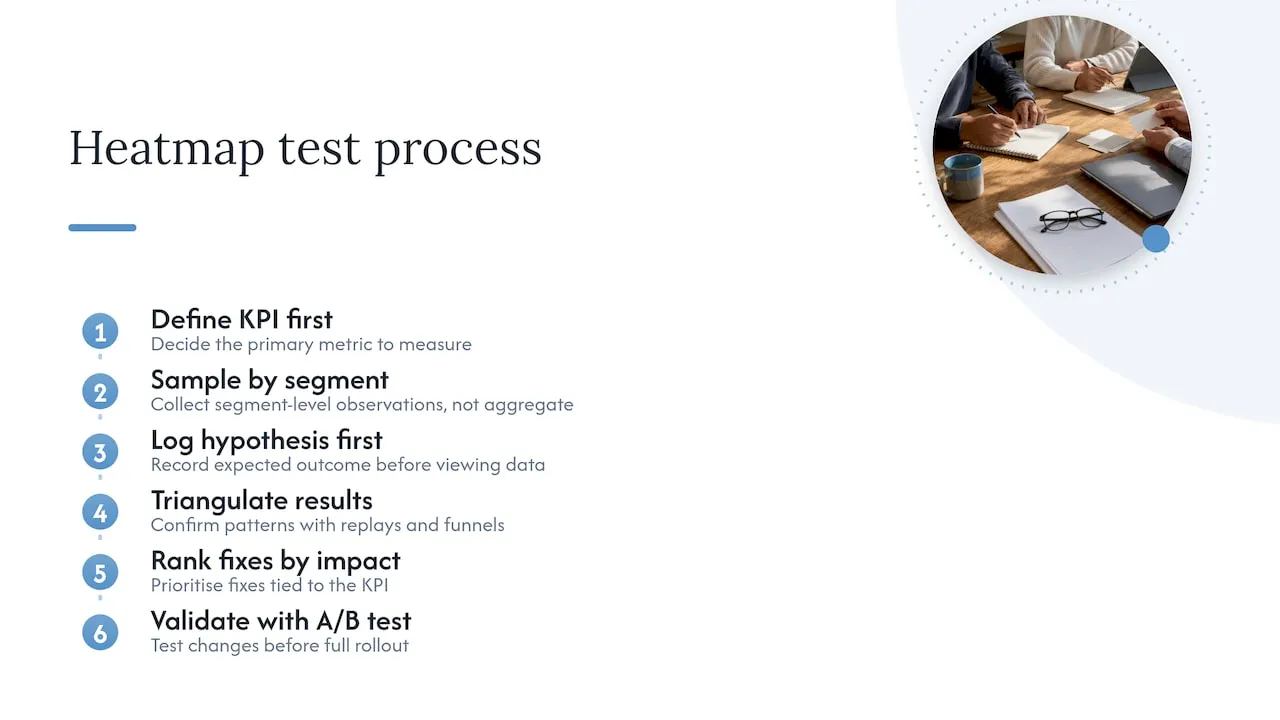
A workable checklist for any heatmap-driven test: define the KPI first, sample by segment rather than in aggregate, log your hypothesis before viewing data, triangulate with replays and funnels, rank fixes by impact, and validate with an A/B test before rolling out. Deliverables worth producing for any team running this process: a hypothesis log, a segmented heatmap grid, and a prioritized fix list tied to the KPI.
Practical perspective: when heatmaps are the right tool, and when to stop
Heatmaps work best as a fast confirmation tool for a narrowly scoped question, like whether a redesigned button gets noticed. They work poorly as a stand-in for understanding motivation. When the “why” stays unclear after triangulating with replays and funnels, or when the stakes involve a high-revenue page, stop running more heatmap variations and move to moderated usability testing or a full UX audit instead. Pattern-matching on colored pixels is cheap. Knowing when to stop trusting them is the actual skill.
- Jeremy
How Forefront Industries helps with heatmap-driven growth
We build the custom infrastructure that turns heatmap findings into shipped fixes: audits of your current tracking setup, custom-coded implementations instead of template patches, prioritized build work ranked by lead or revenue impact, and attribution engineering so you can see which changes actually moved the numbers.

Before reaching out, have ready: access to your current analytics and heatmap data, your top-performing pages, and the KPI you care about most, whether that is lead quality or completed checkouts.
- Request an audit of your current setup through our website maintenance plans, which include Managed Hosting at $99 per month, Webmaster at $250 per month, and Performance Plus at $750 per month.
- Explore custom build and CRM work if your heatmap findings point to a deeper systems problem, not just a page tweak.
FAQ
Can ChatGPT create heatmaps?
ChatGPT cannot generate a real heatmap because it has no access to your visitors’ actual click, scroll, or movement data. It can help you draft hypotheses, interpret patterns you describe to it, or write the analysis plan, but the visualization itself requires a dedicated heatmap tool connected to your site.
What is the best software for heatmap analysis?
There is no single best tool across every situation. Choose based on sampling transparency, segmentation depth, and whether the tool integrates session replays and revenue-weighted views, since those features matter more than the brand name on the dashboard.
What is heatmap analysis and how is it used?
Heatmap analysis is the practice of reviewing color-coded visualizations of click, scroll, or movement data to spot where visitors engage or disengage on a page. It is used to flag potential usability problems, which then get confirmed through session replays, funnel data, or usability testing before any design change is made.
Is there a free heatmap tool?
Several heatmap tools offer free tiers with limited page views or data retention, enough for small sites or early testing. For reliable analysis at scale, especially once you need segment-first sampling and consent-aware tracking, most teams eventually move to a paid plan.
Sources
For deeper detail on sample sizes, scanning behavior, and consent requirements, consult Nielsen Norman Group’s heatmap guidance, Baymard Institute’s UX research methodology, and Google’s Consent Mode documentation linked throughout this guide.