Service Businesses: Which Marketing Attribution Models to Use with GA4 and CRM

If your conversion volume is high and your tracking is clean, a data-driven attribution model will give you the most accurate picture of what is actually driving revenue. If your data is thin or your funnel is short, a simple multi-touch rule, like U-shaped for demand generation or last-click for fast-cycle sales, will serve you better than a poorly trained algorithm. Either way, validate any major budget shift with an incrementality test before you commit real money to it.
TL;DR:
- Data-driven attribution models excel with high conversion volumes and clean tracking, but simple multi-touch rules outperform when data is limited or the funnel is short.
- Algorithmic models like Markov chains and Shapley value provide more accurate insights by analyzing patterns in customer journeys, but require enough data to avoid overfitting.
- Platform changes and privacy restrictions increasingly weaken first-party tracking, making clean CRM and server-side data essential for reliable attribution.
- Combining attribution with incrementality testing offers the most robust measurement, clarifying whether channels truly drive conversions or merely intercept existing demand.
- Proper website and CRM infrastructure, tailored for conversion tracking from the start, is crucial for accurate attribution, especially for service businesses with offline touchpoints.
Table of Contents
- What Is Marketing Attribution, and Why Does It Matter?
- Single-Touch vs. Multi-Touch Attribution Models Explained
- How Data-Driven and Algorithmic Attribution Models Work
- How Do You Choose the Right Attribution Model?
- GA4 and Google Ads: What You Need to Know About Implementation
- Common Attribution Mistakes That Skew Your Numbers
- Real Examples: How Credit Shifts Across Attribution Models
- How Privacy Changes Are Reshaping Attribution Modeling
- Why Attribution and Incrementality Testing Work Better Together
- Multi-Channel and Cross-Device Tracking: Where It Breaks Down
- Best Practices for Visualizing and Reporting Attribution Data
- The Forefront Industries Perspective: Fixing Attribution at the Data Source
- Building an Attribution-Ready Website and CRM System
- Sources
What Is Marketing Attribution, and Why Does It Matter?
Marketing attribution is the process of assigning credit for a conversion to the touchpoints that led to it. An attribution model is the specific rule or algorithm that decides how that credit gets split. Google’s own documentation describes it plainly: a reporting attribution model is a rule set that determines which touchpoints get credit for a key event, and switching models changes both historical and future reports.
A “touchpoint” is any interaction a prospect has with your brand before converting: a paid search click, an email open, an organic visit, a retargeting ad, a sales call. When a single conversion follows several touchpoints, most models split the credit into fractions rather than giving one channel the full win. That fractional credit is where a lot of marketers get confused the first time they switch reporting models and suddenly see 0.3 conversions attributed to a display ad instead of a clean whole number.
Attribution matters because it shapes budget decisions. But attribution only describes correlation between touchpoints and conversions. It does not prove causation.
That distinction separates attribution from incrementality, a causal measurement that asks what would have happened without a given channel. The IAB’s incrementality guidelines frame this clearly: attribution answers “who gets credit,” while incrementality answers “what actually moved the needle.”
A few terms worth locking in before you go further:
- Touchpoint: any tracked interaction with a channel before conversion.
- Fractional credit: partial conversion value split across multiple touchpoints.
- Conversion window: the time frame during which touchpoints count toward a conversion.
- Model comparison report: a GA4/Google Ads tool that shows how conversion counts shift under different models.
Single-Touch vs. Multi-Touch Attribution Models Explained
Attribution models fall into two broad families: single-touch, which gives 100% of the credit to one interaction, and multi-touch, which spreads credit across several. Picking between them is really a question of how much of the customer journey you want visibility into, and how much data you have to support that visibility.
Single-touch models
First-touch attribution gives all the credit to the very first interaction a prospect had with your brand. It is useful for understanding what drives awareness and top-of-funnel discovery, but it tells you nothing about what closed the deal.
Last-touch attribution gives all the credit to the final interaction before conversion. It remains one of the few legacy rule-based models Google Ads still supports after deprecating others, according to Google’s attribution documentation. Last-touch works reasonably well for short sales cycles, like ecommerce purchases completed in a single session, but it overweights bottom-funnel channels like branded search and retargeting while starving the channels that built demand in the first place.
Multi-touch rule-based models
Multi-touch models split credit across every touchpoint in the path, using a fixed rule rather than a trained algorithm. Here is how the main variants work:
- Linear splits credit evenly across every touchpoint. Simple, transparent, and a reasonable default when you have no strong hypothesis about which stage matters most.
- Time-decay gives more credit to touchpoints closer to conversion. It fits sales cycles where recency signals genuine intent, like B2B demos scheduled shortly after a webinar.
- Position-based (U-shaped) assigns 40% to the first touch, 40% to the last touch, and splits the remaining 20% across the middle. It works well when both discovery and closing channels matter equally, which is common in demand-generation motions.
- W-shaped adds a third anchor point, typically the moment a lead converts to a marketing-qualified or sales-qualified lead, giving heavier weight to three key stages instead of two.
- Full-path extends W-shaped further by weighting the opportunity-creation and closed-won stages too, which suits long B2B cycles with distinct sales handoffs.
- Custom rule-based models let you set your own weights per stage, useful once you have enough historical data to know your funnel does not match any standard shape.
Pro Tip: Match the model to the business question you’re asking, not the one that makes your favorite channel look best. If you’re evaluating top-of-funnel spend, use first-touch or U-shaped. If you’re optimizing bottom-funnel bidding, time-decay or last-touch will give you a cleaner read.
How Data-Driven and Algorithmic Attribution Models Work
Rule-based models apply a fixed formula regardless of what actually happened in your data. Data-driven and algorithmic models learn the credit split from patterns in your own conversion paths, which is why they tend to produce more accurate results once you have enough volume to train them.
Two techniques anchor most algorithmic attribution: Markov chains and Shapley value.
Markov chain attribution models the customer journey as a series of states (channel exposures) and calculates a “removal effect,” measuring how much conversion probability drops when a specific channel is removed from the graph entirely. A channel with a large removal effect is doing real work even if it rarely appears as the last touch, which is exactly the kind of contribution last-click attribution misses. This approach, described in academic and practitioner literature on Shapley and Markov attribution methods, is particularly good at identifying enabling channels, the ones that do not close deals but make closing possible.
Shapley value attribution borrows from cooperative game theory. It calculates each channel’s average marginal contribution across every possible combination of channels in the path, which produces a mathematically fair split but gets computationally expensive fast as path length grows.
Machine learning models go further, training on hundreds of variables beyond simple channel sequence, including time-of-day, device, creative variant, and audience segment. They can surface interactions no rule-based model would ever catch. They also introduce real risk:
- Opacity makes it hard to explain to stakeholders why a channel’s credit moved.
- Overfitting on thin data produces confident-looking numbers that do not hold up out-of-sample.
- Retraining cadence matters. A model trained on last year’s funnel can misread this year’s behavior if your channel mix shifted.
The practical threshold most practitioners point to is conversion volume: below a few hundred conversions a month, simple heuristics often perform just as well as an algorithmic model trained on too little data, per multitouch attribution guidance from the AMA. Complexity is not a virtue on its own. It has to earn its keep.
How Do You Choose the Right Attribution Model?
Model choice comes down to three variables: how long your sales cycle runs, how many channels touch a typical buyer, and how much clean conversion data you have to work with.
Sales cycle length determines how much of the journey you can actually observe. A same-day ecommerce purchase has a short, trackable path where last-touch or time-decay works fine. A six-month B2B sales cycle spans emails, sales calls, and offline meetings that a cookie-based model may never see, which pushes you toward full-path or W-shaped models paired with CRM data.
Channel complexity matters just as much. If you run three channels, a linear or U-shaped model captures nearly everything useful. If you run twelve channels across paid, organic, lifecycle email, and events, a rule-based model starts averaging away real differences that an algorithmic model would catch.
Conversion volume and data maturity decide whether an algorithmic model is even worth attempting. Practitioner research is consistent on this point: marketers with limited conversion counts often get more reliable, actionable numbers from a simple multi-touch rule than from an algorithmic model trained on too little data.
Run through this checklist before you commit to a model:
- Do you have at least a few hundred monthly conversions in the relevant funnel?
- Is your tracking consistent across channels, with UTMs and CRM data actually reconciled?
- Are you trying to answer a discovery question (what starts the journey), a closing question (what finishes it), or a full-funnel optimization question?
- Have you run a model comparison report to see how allocations shift between models before picking one?
- Do you have the resourcing to interpret fractional credit and explain it to finance or leadership?
Pro Tip: Run your GA4 model comparison report before you argue about which model is “right.” Seeing exactly how much credit shifts between last-click and data-driven for your own data will settle more internal debates than any theoretical argument.
GA4 and Google Ads: What You Need to Know About Implementation
Google’s own platforms have pushed hard toward data-driven attribution as the default, which changes how you should read your reports even if you never touch the model settings yourself.
In GA4, changing the reporting attribution model affects both historical and future key event reports. If you switch from last-click to data-driven, expect to see fractional credit values, like 0.4 conversions attributed to a channel that used to show a clean whole number under last-click. That is not a tracking error. It is the model doing exactly what it is designed to do.
Google Ads has gone further, deprecating several legacy rule-based options. According to Google Ads’ attribution documentation, first-click, linear, time-decay, and position-based models were phased out for many accounts, with existing conversions upgraded automatically to data-driven attribution. Last-click remains supported, but it is no longer the default path for most advertisers.
Statistic Callout: When you switch reporting attribution models in GA4, the change applies retroactively to historical key event data as well as future reporting, per Google’s own documentation. Your year-over-year comparisons can shift without any actual change in campaign performance.
Model choice also feeds directly into Google Ads bidding. Smart Bidding strategies use the attribution model’s credit assignment as a training signal, so a model change can quietly shift which keywords and audiences get more budget.
Attribution data itself comes from several sources that rarely line up cleanly:
- Client-side and server-side tracking via GA4, GTM, or platform SDKs.
- UTM parameters on campaign links, which break the moment someone forgets to tag a post.
- CRM merges that connect online touchpoints to offline sales activity.
- Call tracking and in-store visit data for businesses with an offline component.
Reconciling those sources usually takes more work than the model math itself. For a deeper look at how GA4 attribution logic interacts with unusual traffic patterns, analytics teams tracking LLM referral traffic have documented similar reconciliation issues worth reviewing.
Common Attribution Mistakes That Skew Your Numbers
The most common failure is not a bad model. It is switching models until one confirms the budget you already wanted to spend, a practice sometimes called model shopping. Left unchecked, it turns attribution into an internal politics tool instead of a measurement discipline. The fix is governance: pick a model, document why, and require a real business reason (not a convenient number) to change it.
The second mistake is treating attribution as causation. A channel with heavy credit in your dashboard did not necessarily cause those conversions. It may simply intercept intent that already existed. The IAB’s incrementality guidelines draw this line explicitly: only a controlled experiment, holdout test, or geo-lift study answers the causal question attribution cannot.
The third mistake is platform drift. When Google or another platform changes its supported models, your allocations can shift materially with zero change in your actual campaigns or creative, as Google Ads’ own model deprecation history shows.
- Set a model-change policy that requires a documented business reason, not a convenient number.
- Re-run model comparison reports before adjusting bids after any platform update.
- Schedule incrementality tests on a fixed cadence, not just when someone questions a number.
Pro Tip: Calendar a quarterly incrementality check on your top two spending channels, even if nothing looks wrong. Platform drift is silent, and you will not notice a problem until the budget conversation is already happening.
Real Examples: How Credit Shifts Across Attribution Models
Picture a buyer who sees a display ad, clicks a paid search ad two weeks later, opens a nurture email, then converts through a branded search click.
Under last-touch, branded search gets 100% of the credit. Under first-touch, the display ad gets it all. Under linear, each of the four touchpoints gets 25%. Under U-shaped, display and branded search each get 40%, while paid search and email split the remaining 20%.
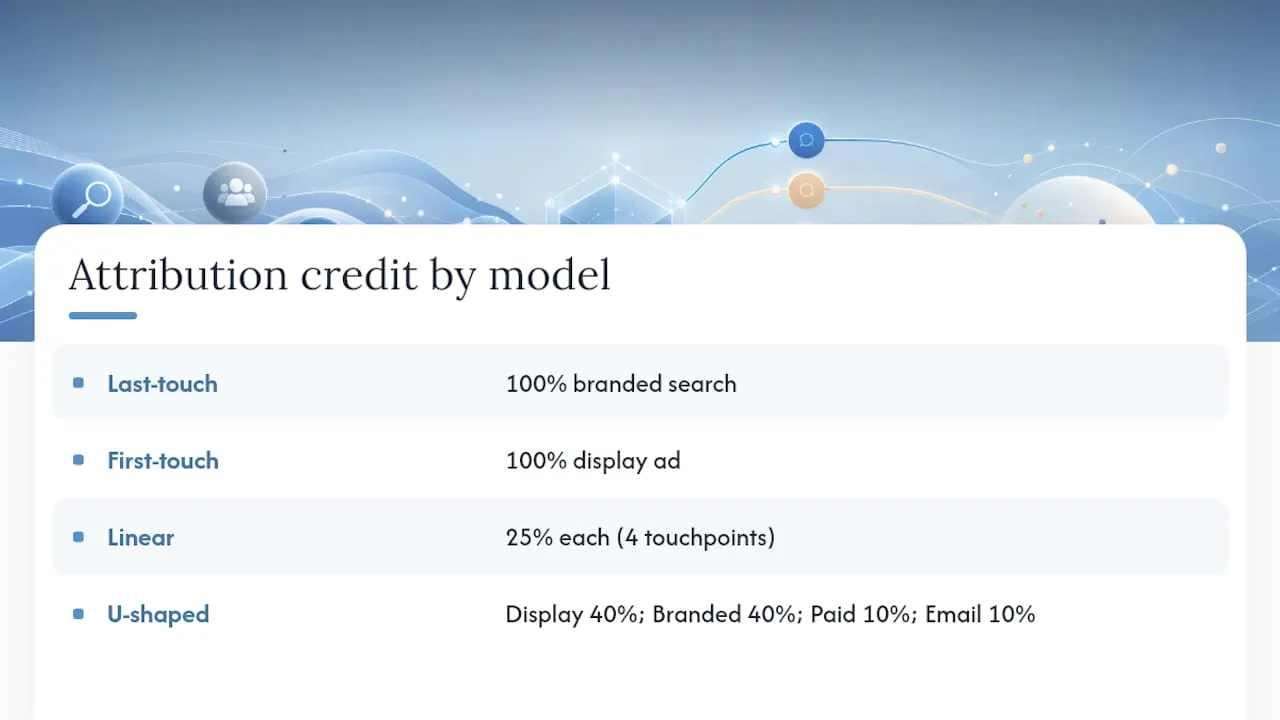
That shift matters for real conversations. If your team funds channels based on last-touch alone, display advertising looks like a waste of budget in this path even though it started the journey.
Statistic Callout: Switching a GA4 property from last-click to data-driven attribution applies retroactively to historical reports, which is exactly why finance teams see conversion totals move even when nothing in the campaigns changed.
Finance teams reading fractional credit for the first time often assume something is broken. It is not. A channel showing 0.3 conversions under a data-driven model is receiving a proportional share of shared credit, not an incomplete count.
How Privacy Changes Are Reshaping Attribution Modeling
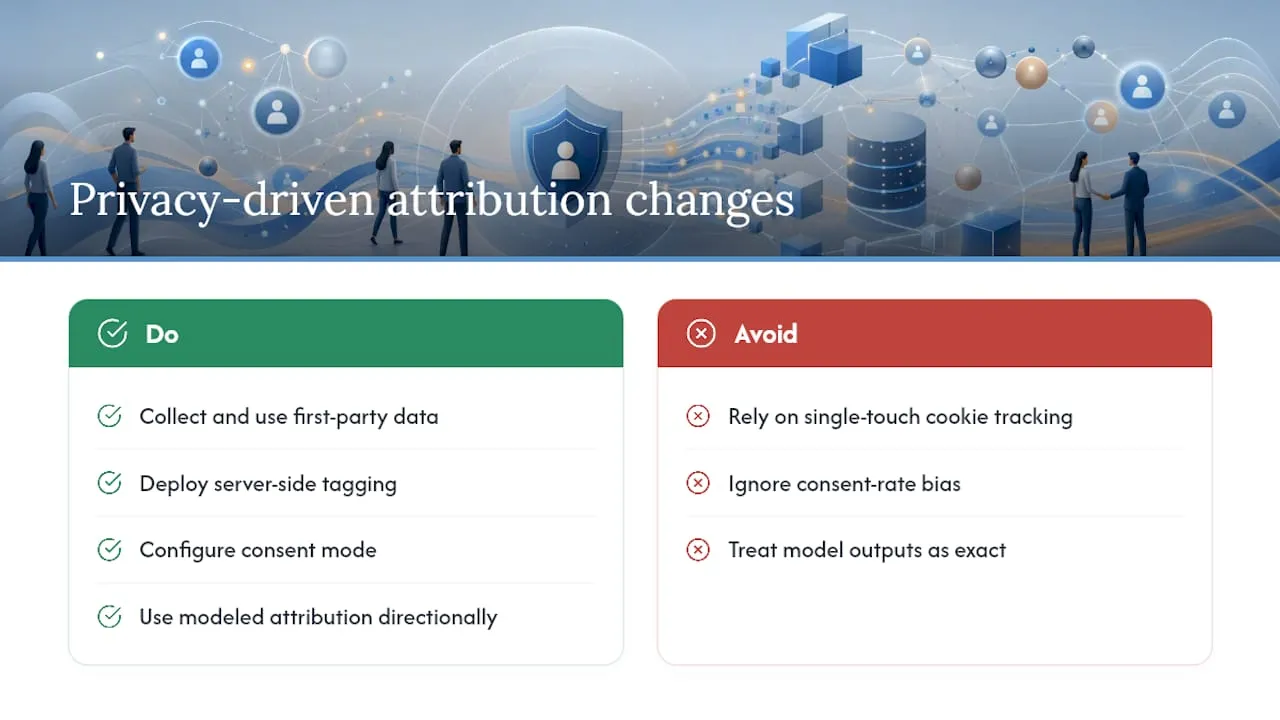
Cookie restrictions, browser-level tracking limits, and state and federal privacy rules have made single-touch, cookie-dependent tracking far less reliable than it was even a few years ago. Safari and Firefox both limit third-party cookie lifespan by default, and browser-level signal loss means a meaningful share of touchpoints simply never reach your analytics platform.
This pressure is a direct driver behind Google’s push toward data-driven attribution across GA4 and Google Ads. When individual-level tracking degrades, aggregated and modeled approaches, which infer patterns from the traffic you can still see, become more valuable than deterministic path-following.
Practically, this means a few things for your setup. First-party data, meaning information you collect directly through your own site and CRM rather than third-party cookies, becomes the backbone of reliable attribution. Server-side tagging reduces reliance on browser-based collection that ad blockers and privacy settings routinely strip out. Consent-mode configurations affect how much of your traffic even generates a trackable event in the first place, and gaps in consent rates can quietly bias your reports toward the audiences who consented, not your audience as a whole.
None of this means attribution modeling has become useless. It means the raw signal feeding every model, from simple linear to full Shapley value, is thinner than it used to be. Modeled conversions and aggregated reporting are Google’s answer to that gap, but they are estimates layered on top of estimates. Treat any single model’s output as directionally useful, not precise to the decimal point it displays.
Why Attribution and Incrementality Testing Work Better Together
Attribution and incrementality are not competing frameworks. They answer different questions, and the strongest measurement setups run both.
Attribution tells you which touchpoints were present in the paths that converted. Incrementality tells you what conversion volume would have happened anyway, without the marketing spend in question, measured against a genuine counterfactual, like a geo-holdout or a randomized control group. The IAB’s guidelines on incremental measurement are explicit that these are separate causal and correlational questions, not two versions of the same answer.
Algorithmic attribution methods like Shapley value and Markov chains complement experimental approaches well, since combining modeled output with periodic experiments gives you both a fast, continuous signal and a periodic causal check.
Teams for incrementality testing in ecommerce have documented how a holdout test can directly contradict what an attribution model reports for the same channel, and the holdout result is the one you should trust for the budget decision.
Multi-Channel and Cross-Device Tracking: Where It Breaks Down
The hardest part of attribution is rarely the model math. It is stitching together a single customer’s activity across devices, browsers, and channels without losing the thread.
A prospect might see a display ad on their phone during a commute, research on a work laptop the next day, and convert on a personal tablet that evening. Without an identity resolution strategy, an attribution model sees three unrelated visitors, not one journey, and it will misassign credit to whichever device happened to convert.
A few practical fixes address most of the gap:
- Logged-in identity matching through account creation or email capture ties sessions together across devices when a user authenticates.
- CRM-based stitching merges online session data with known contact records, closing the gap between anonymous web behavior and identified leads.
- Server-side tagging captures events more reliably than client-side pixels, which browser privacy settings frequently block or truncate.
- Cross-device modeling from ad platforms fills remaining gaps probabilistically, though it is an estimate, not a certainty.
Service businesses with offline components, consultations, in-person visits, phone-based sales, face an even bigger version of this problem: the touchpoint that actually closes the deal may never touch a browser at all. That is precisely why CRM integration, not just better pixel tracking, tends to close more of the attribution gap than any tracking tweak alone.
Best Practices for Visualizing and Reporting Attribution Data
A model comparison report that nobody outside the marketing team can read is not doing its job. The goal of attribution reporting is a shared understanding across marketing, finance, and leadership of where credit is landing and why.
Start with a model comparison view side by side, showing the same conversion data under at least two models (typically your current default and data-driven) so stakeholders see the range of plausible answers rather than one number presented as fact. A single chart claiming precise channel percentages, without that range, tends to create false confidence in a number that shifts meaningfully depending on the rule behind it.
Pair channel-level attribution charts with a trend line over time, not just a snapshot.
Always annotate reports when the underlying model changes. If your GA4 property switched from last-click to data-driven mid-quarter, mark that date on every chart that spans it. Without that annotation, a jump in a channel’s credited conversions looks like a performance change when it is really a measurement change.
Finally, pair every attribution report with the most recent incrementality test result, even a summary line. A dashboard that shows attribution numbers in isolation, with no reference to whether those numbers have ever been validated against a real experiment, invites decisions built on correlation alone.
The Forefront Industries Perspective: Fixing Attribution at the Data Source
Service businesses have it harder than ecommerce brands when it comes to attribution. Sales cycles run weeks or months, deals close through phone calls and consultations that never generate a pixel event, and the “conversion” a marketing dashboard sees is often just the first of several steps a CRM tracks separately. That mismatch is why multi-touch models paired with incrementality testing matter more here, not less.
The fix is rarely a better attribution model. It is better instrumentation. When CRM and lifecycle systems are properly built to capture every stage from first contact through closed deal, attribution models finally have the offline data they were always missing. A custom-built web platform designed with tracking in mind from day one closes more of that gap than any attribution model switch ever will.
- Jeremy
Building an Attribution-Ready Website and CRM System
Choosing the right attribution model only gets you so far if the underlying data feeding it is full of gaps, untagged campaigns, disconnected CRM records, or a website that was never built to track anything beyond page views. Some specialized firms build the infrastructure that sits underneath the attribution question: custom-coded websites, CRM systems on Salesforce Marketing Cloud and Braze, and lifecycle automation that connects online behavior to offline sales outcomes.

That combination matters most for service businesses with long sales cycles and offline touchpoints, exactly the funnels where rule-based attribution models struggle most without CRM data feeding them. If you are running lean and already have solid conversion volume with clean tracking, an in-house analyst can often manage model selection and reporting without outside help. If your tracking has gaps, your CRM and website do not talk to each other, or nobody on your team has time to reconcile UTM data with sales records, that is when a build partner earns its cost.
Forefront’s custom web development work is built around conversion tracking and CRM integration from the first line of code, not bolted on afterward. If your current setup cannot answer basic attribution questions with confidence, a properly instrumented site and CRM system is the fastest way to change that. Consider reaching out to a qualified digital growth infrastructure partner to scope what your funnel actually needs.
Sources
- Change the reporting attribution model for key events - Analytics Help
- IAB and IAB Europe - Guidelines: Incremental Measurement
- Attribution modeling chapter (Springer) - Shapley and Markov approaches
- Multitouch attribution in the customer purchase journey - AMA