100 Point Lead Scoring Model Template: Fit, Intent, Decay Rules

Lead scoring models assign numeric values to prospect fit and behavior, so sales and marketing agree on which accounts deserve attention first. Start with a rules-based or tiered model built from a meaningful sample of your closed deals, then graduate to predictive scoring once you have clean, consistent outcome data. Every model tracks two dimensions: fit (does this account match your ideal customer) and engagement (are they acting like a buyer).
TL;DR:
- Rules-based models are suitable for initial implementation, but they require continuous updates and clear documentation to remain effective.
- Behavioral signals such as website visits, demo requests, and third-party intent data provide high-value signals for scoring high-potential leads.
- Account-level multipliers strengthen scores when multiple contacts engage, reflecting the collective buying influence within B2B organizations.
- Backtesting scores against historical data pinpoints appropriate threshold levels, typically around 70 for high conversion likelihood, before shifting to predictive models.
- Maintaining clean, integrated CRM data and revisiting scoring rules quarterly are more critical than developing complex models that won’t perform well with poor data.
Table of Contents
- What Is Lead Scoring, and Why Does It Matter?
- What Types of Lead Scoring Models Exist?
- What Signals Should a Lead Scoring Model Track?
- How Do You Design a Lead Scoring Model Step by Step?
- A 100-Point Lead Scoring Template You Can Copy
- How Do You Validate and Calibrate a Lead Scoring Model?
- How Do Routing Bands and Decay Rules Work in Practice?
- When Should You Move to Predictive Lead Scoring?
- What Forefront Industries Has Learned Building Enterprise CRM Systems
- The Part of Lead Scoring Nobody Wants to Admit
- Get Your Lead Scoring Model Built on a Foundation That Can Actually Support It
- Sources
What Is Lead Scoring, and Why Does It Matter?
Lead scoring and lead grading get used interchangeably, and that’s the first mistake most teams make. A score measures intent, the behavioral signal that someone is actively evaluating a purchase. A grade measures fit, whether the account matches your ideal customer profile at all. Separating these two dimensions is what keeps a high-activity, poor-fit lead (a student researching your category for a class project) from getting routed to your best account executive alongside a quiet, perfect-fit enterprise buyer who only visited your pricing page once.
Teams format scores three common ways. A 0-100 point system gives the most granularity and is easiest to backtest. A letter-grade system (A through D) communicates fit quickly to sales reps who don’t want to parse numbers. A matrix, plotting fit on one axis and engagement on the other, shows both dimensions at once and is often the clearest way to define what actually qualifies as a marketing-qualified lead (MQL).
The business case for doing this well shows up in three places:
- Prioritization. Reps spend their limited outreach hours on accounts statistically more likely to close, not whoever filled out a form five minutes ago.
- Sales-accepted lead (SAL) rates. When marketing and sales agree on what a qualified lead looks like before the handoff, fewer leads get rejected or ignored downstream.
- Faster service-level agreement (SLA) response times. A model that flags genuinely hot leads lets sales commit to aggressive response windows on a smaller, higher-value subset instead of promising fast follow-up on everything.
None of this requires machine learning on day one. It requires agreement on what a score means and discipline in how you calculate it.
What Types of Lead Scoring Models Exist?
Four model families cover almost every implementation you’ll encounter, and each fits a different stage of data maturity.
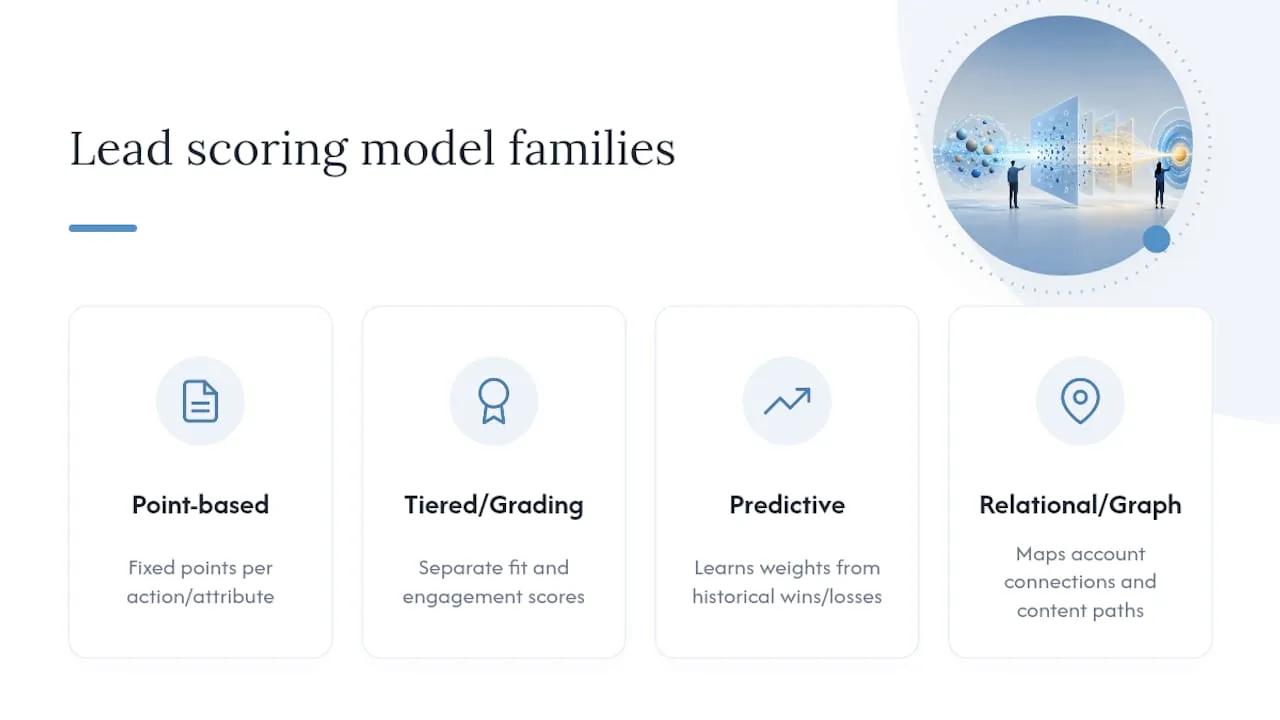
Point-based rules are the default starting point for good reason. You assign fixed point values to actions and attributes (a demo request is worth 20 points, a pricing page visit is worth 10), sum them up, and route based on the total. They’re transparent, cheap to build, and easy to explain to a sales team that will immediately ask “why did this lead get flagged.” The tradeoff is that they don’t adapt on their own. If a signal stops predicting conversions, the rule keeps firing anyway until someone notices and updates it.
Tiered or grading models separate fit from engagement explicitly, usually as two scores or a matrix. This structure exists specifically to avoid the false positive problem: an intern at a Fortune 500 company downloading every whitepaper you publish racks up engagement points fast, but a grading layer keeps that lead out of your top sales tier until the fit criteria (title, company size, industry) also clear a bar.
Predictive models, typically built on machine learning, analyze historical closed-won and closed-lost data to weight signals automatically rather than relying on someone’s best guess. Microsoft’s Dynamics 365 Sales, for example, generates a 0-100 predictive score and surfaces the top positive and negative reasons behind each number, which solves the “black box” objection sales teams often raise. Predictive scoring needs volume and clean labels to work. Feed it noisy, inconsistent CRM data and it will confidently produce a wrong answer.
Relational or graph-based models go a step further, mapping connections between contacts at the same account and tracking how someone moves through your content over time. Signals like colleague conversions and content-progression sequences are invisible to a flat spreadsheet model but can meaningfully sharpen precision at the top of your funnel, since B2B deals are rarely decided by one person acting alone.
Pro Tip: Don’t skip straight to predictive because it sounds more sophisticated. A clean point-based model that everyone trusts will outperform a black-box model built on messy data, every time.
What Signals Should a Lead Scoring Model Track?
A model is only as good as the signals feeding it, and most teams either track too few or drown in ones that don’t predict anything. Group your signals into five categories.
Firmographic fit signals answer “should we even be talking to this account.” Company size, industry, geography, and tech stack all belong here, since they rarely change week to week and establish the baseline ceiling for how high a lead can score regardless of behavior.
Behavioral engagement signals, ordered roughly by intent level from low to high, include:
- Blog or resource page visits (low intent, informational)
- Webinar attendance or case study downloads (mid intent, evaluating)
- Pricing page visits (high intent, comparing options)
- Demo requests or free trial signups (highest intent, ready to talk)
Intent signals come from outside your own website: third-party intent data providers that track when a company is researching your category across the web, not just on your domain. These add real signal for accounts that haven’t visited your site yet but are actively shopping.
Account-level multipliers matter in B2B because deals are rarely one-person decisions. When multiple contacts at the same account engage independently, that’s a stronger buying signal than one person engaging five times, so many models apply a multiplier once a second or third colleague shows up.
Negative signals and disqualification rules protect your model from false positives. Job-seeker behavior, personal email domains, and repeated careers-page visits should trigger hard disqualification flags, not just point deductions buried in the total.
How Do You Design a Lead Scoring Model Step by Step?
Building a model that actually works follows a fairly consistent sequence, whether you’re doing it in a spreadsheet or inside enterprise CRM tooling.
- Audit your closed-won deals first. Pull your last 200 to 500 wins (and an equal set of losses, if you have them) and look for the attributes and actions that show up disproportionately often before conversion. This is your evidence base, not a guess.
- Choose your model type and define subscores. Decide whether you’re running a single blended score or separate fit, intent, and account subscores. Most teams find three subscores easier to act on than one number that hides the reasoning.
- Assign initial weights, caps, and negative points, and document every rule. Write down why each signal got the weight it did. Six months from now, someone will ask, and “I don’t remember” is not a good answer during a model review.
- Implement decay and account-level aggregation. A demo request from 90 days ago shouldn’t carry the same weight as one from yesterday. Half-lives should vary by signal strength, with high-intent actions like pricing or demo visits decaying faster (around 14 days) than lower-intent content engagement (closer to 30 days).
- Backtest retroactively before you launch. Apply the model to historical leads and see where conversion rates actually jump. That inflection point, not a round number like 50 or 75, is where your MQL threshold belongs.
- Operationalize routing and set a recalibration cadence. Connect score bands to specific sales actions and revisit the whole model quarterly, since what predicted conversions last year may not predict them this year.
Pro Tip: Document your scoring rules in a shared, version-controlled document, not just in your CRM’s configuration screen. When someone asks why a threshold changed, you want a paper trail, not a shrug.
A 100-Point Lead Scoring Template You Can Copy
A practical starting template splits the full 100 points across three buckets: 40 for fit, 40 for intent, and 20 for recency and account-level activity. This allocation, drawn from common B2B scoring templates, gives fit and current buying intent roughly equal weight while still rewarding sustained account engagement.
| Signal | Points | Cap | Suggested decay half-life |
|---|---|---|---|
| Job title matches decision-maker profile | 40 | 40 | None (static fit signal) |
| Company size within ideal range | 40 | 40 | None (static fit signal) |
| Industry match | 10 | 10 | None (static fit signal) |
| Demo request | 20 | 20 | 14 days |
| Pricing page visit | 10 | 10 (2 visits max at 5 pts each) | 14 days |
| Webinar attendance | 6 | 6 | 30 days |
| Case study download | 4 | 8 (two downloads) | 30 days |
| Second contact at same account engages | 10 | 10 | 30 days |
| Repeat visits within 14 days | 10 | 10 | 14 days |
A few operating notes make this table usable rather than theoretical. Cap each row so one enthusiastic click-through spree can’t single-handedly push a poor-fit lead into your top tier. Negative points (a personal email domain, a careers-page visit) should subtract directly from the total and can be uncapped downward, since disqualifying a bad lead fast matters more than being gentle about it.
How Do You Validate and Calibrate a Lead Scoring Model?
A model you haven’t backtested is a guess wearing a spreadsheet. Validation means retro-scoring your historical leads with the new rules and checking whether the score actually correlates with what happened to them.

Start by applying your model to six to twelve months of past leads, then plot conversion rate against score bands to find where the curve bends. If leads scoring 60 to 69 convert at 8% and leads scoring 70 to 79 convert at 24%, your MQL threshold probably belongs right around 70, not at some round number picked out of habit.
The metrics that matter most:
- Conversion rate by score band (the core validation check)
- SAL rate (how often sales accepts what marketing flags as qualified)
- Time-to-opportunity (does a high score actually correlate with a faster sales cycle)
- Win rate for opportunities that originated above your MQL threshold
Recalibrate quarterly. Markets shift, your product changes, and a signal that predicted conversions in January can go flat by summer. Watch for data drift, where the mix of incoming leads changes enough that your old weights no longer apply, and for noisy labels, where sales reps mark deals “closed lost” inconsistently and quietly corrupt your training data.
Where models typically go wrong: overfitting to a small or unusual batch of historical deals, training on mislabeled outcomes, or building the initial sample from one unusually good (or bad) quarter that doesn’t represent normal pipeline behavior. Any of these will make a model look accurate in testing and fall apart in production.
How Do Routing Bands and Decay Rules Work in Practice?
A score only creates value once it triggers an action. Most operational models use four bands.
- Monitor (0 to 39): No sales action. Leads stay in general nurture content.
- Nurture (40 to 59): Automated lifecycle emails targeted to the lead’s fit profile, no direct outreach yet.
- MQL review (60 to 74): Marketing hands off to sales development for a qualification call within a standard SLA, often same business day.
- Sales-ready (75+): Immediate routing, with a tight SLA. Commonly, contact within one hour, since data consistently shows response speed correlates with conversion at this tier.
Two guardrails keep this from misfiring. Set a minimum fit subscore before a lead can reach the top band at all, so a highly engaged but completely wrong-fit account never reaches a rep’s desk. Set a minimum intent subscore separately, so a perfect-fit account that’s shown zero buying behavior doesn’t get called cold just because their firmographics look good on paper.
For decay and missing data, treat unknown fit fields conservatively rather than defaulting them to zero or full points. A missing job title, for instance, should score as neutral, not as a penalty or a bonus, until enrichment fills the gap.
When Should You Move to Predictive Lead Scoring?
Predictive scoring earns its complexity once you clear a few thresholds, not before. Machine learning models need a meaningful volume of historical conversions and clean, consistently recorded outcome labels, or they overfit and quietly underperform a well-built rules model.
Run through this checklist before you consider the jump:
- Your rules-based model is live, documented, and has run for at least two full quarters
- Sales and marketing record outcomes (won, lost, disqualified) consistently in the CRM
- You have 6 to 12+ months of labeled historical data with a reasonable sample of conversions
- You have data engineering bandwidth to maintain a model, not just build one
Tooling splits into three broad categories: CRM-native predictive scoring (fastest to deploy, tied to whatever platform you already run), third-party intent enrichment (adds external buying signals your CRM can’t see on its own), and relational graph models (best for larger organizations with complex, multi-contact deal cycles). Each trades transparency for performance differently, and the right choice depends on how much explainability your sales team demands.
What Forefront Industries Has Learned Building Enterprise CRM Systems
Forefront Industries builds CRM and lifecycle systems for service businesses on platforms like Salesforce Marketing Cloud and Braze, and the pattern that shows up most often isn’t a scoring formula problem. It’s a data hygiene problem. A model can only weight signals it can actually see cleanly, which means web forms, CRM fields, and product usage events all need to map to the same lead record without duplication or gaps.
Aligning scoring with web, CRM, and product signals in one clean pipeline is what makes decay rules and account multipliers actually work in production rather than in a demo. Teams with enterprise-level lifecycle marketing experience, working with brands including Ring, Blink, and Audible during in-house enterprise work at Amazon, tend to treat that plumbing as the real project, with the scoring logic itself as the easier half of the work.
The Part of Lead Scoring Nobody Wants to Admit
Most lead scoring advice treats the model like the hard part. It isn’t. The hard part is the discipline to actually document your weights, revisit them quarterly, and kill signals that stop predicting anything, which is exactly the step most teams skip after the initial build.
The conventional wisdom oversells predictive scoring as the mature endpoint every team should aim for. In practice, a documented, well-maintained point system beats a neglected predictive model more often than the marketing around machine learning suggests, because predictive scoring degrades silently when nobody watches the inputs.
If you take one thing from this guide, prioritize the backtest before you prioritize the sophistication. A 100-point spreadsheet model, validated against your actual closed deals and revisited every quarter, will outperform an unvalidated model of any kind. Get the plumbing and the discipline right first. The fancier math can wait until the data earns it.
- Jeremy
Get Your Lead Scoring Model Built on a Foundation That Can Actually Support It
A scoring model is only as reliable as the CRM data feeding it, and that’s where most in-house builds stall out. Forefront Industries specializes in exactly this gap: custom-coded CRM and email systems on platforms like Salesforce Marketing Cloud and Braze, built for service businesses that need clean data flow between their website, CRM, and lifecycle marketing rather than another templated integration.

Hire Forefront Industries when your scoring project runs into enterprise-level complexity: multiple systems that don’t talk to each other, inconsistent field mapping, or a predictive rollout that needs real data engineering, not just a new dashboard. If the fix is smaller, tightening a form, cleaning a workflow, in-house teams can often handle it. When it’s the underlying architecture holding your scoring back, that’s a different problem. Check out Forefront Industries’ custom web development services to see how a properly engineered data pipeline sets up every scoring model you build afterward to actually work.
Sources
- Understand predictive lead scoring (Dynamics 365 Sales)
- Kumo
- Lead Scoring Models: How to Build Your First One (2026) | Leadanic
- B2B Lead Scoring Model: 100-Point Template (2026)
- Lead scoring - Wikipedia