Prove Marketing Automation ROI in 90 Days with Incrementality

Marketing automation delivers real, measurable ROI, but only when you measure it correctly and execute the buildout well. Nucleus Research’s meta-analysis found an average $5.44 returned for every $1 spent over three years, and a 2026 survey of 487 companies found a median first-year ROI of 300% to 400%. The catch: attribution and implementation quality separate the winners from the disappointed. This guide gives you the formulas, metrics, and testing methods to calculate and improve your own number.
TL;DR:
- Most companies see positive ROI within 90 days due to rapid AI-assisted implementation, but full first-year ROI typically requires more time and solid data foundation.
- Neglecting to include all relevant costs, such as labor and software setup, can significantly inflate perceived ROI, leading to overly optimistic expectations.
- Proper incrementality testing is essential to accurately measure automation’s true contribution, as naive attribution tends to overstate impact by up to 50%.
- Regular monitoring of funnel leak rates, deliverability, and engagement metrics helps catch early signs of performance issues before they affect ROI.
- Data quality and disciplined testing outweigh platform features in determining automation success, making custom systems and consistent testing vital for maximizing ROI.
Table of Contents
- How Do You Calculate Marketing Automation ROI?
- Which Metrics Actually Feed Your ROI Number?
- How Do You Avoid Overstating Automation’s Impact?
- What Should You Monitor Between ROI Reports?
- What Actually Moves Marketing Automation ROI Higher?
- What ROI Benchmarks Should You Expect and When?
- Why Do Automation Programs Underperform?
- Does Custom Implementation Actually Change the Numbers?
- A Straight Take On Automation ROI
- Get a Faster Path to Measurable ROI
- Sources
- FAQ
How Do You Calculate Marketing Automation ROI?
The base formula is simple: (Revenue − Cost) / Cost, expressed as a percentage. A profit-based variant subtracts cost of goods sold before the calculation, which matters if you sell physical products with real margin pressure rather than pure services.
Three related metrics get confused constantly, and mixing them up leads to bad decisions:
- ROI measures net return against total cost, the figure finance actually cares about.
- ROAS (return on ad spend) measures revenue against media spend only, ignoring labor and tooling.
- MER (marketing efficiency ratio) measures total revenue against total marketing spend across every channel combined, useful for board-level reporting but too blunt for campaign decisions.
Before you calculate anything, gather every cost bucket. The Zogby marketing ROI calculator recommends including software licensing, setup and configuration labor, creative production, agency or contractor fees, and ongoing management time. Skip any of these and your ROI looks artificially inflated. HubSpot’s measurement guidance makes the same point about dollarizing labor hours that often get treated as “free” internal time.
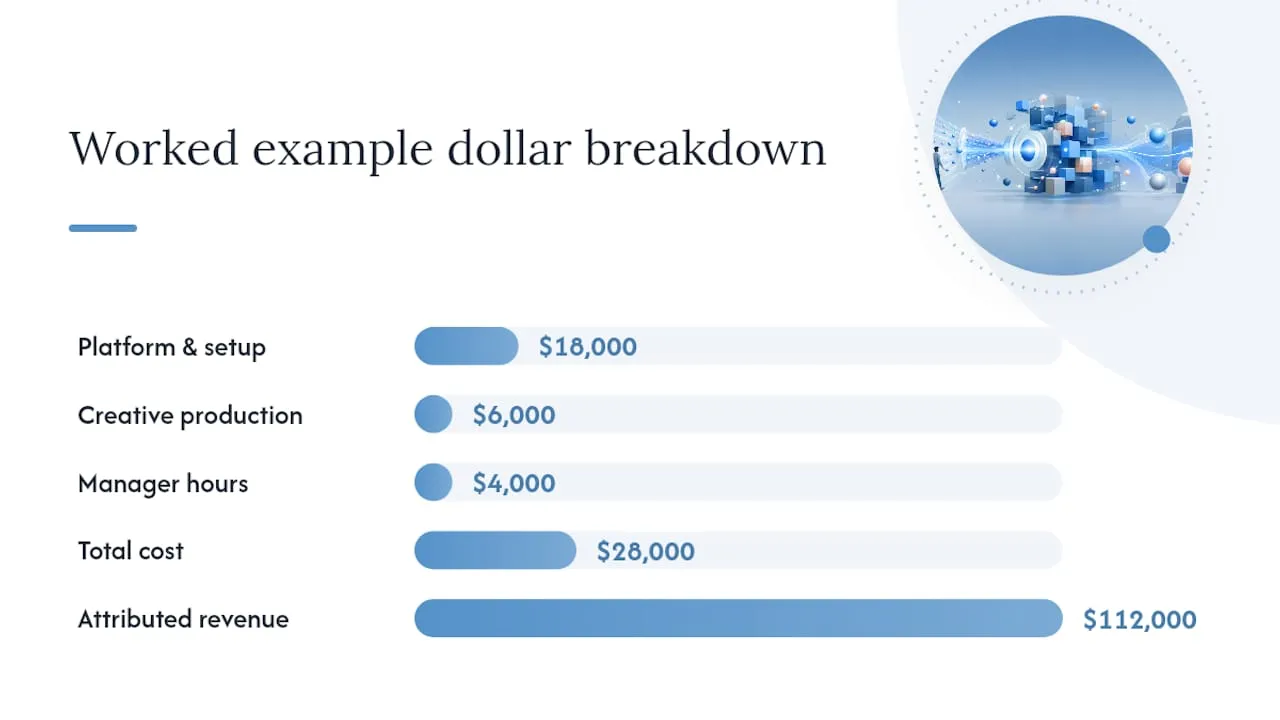
Here’s a worked example. A mid-size services firm spends $18,000 on a lifecycle email platform and setup, $6,000 on creative, and $4,000 on a part-time manager’s hours over the first year, for a total cost of $28,000. The automated nurture sequences and lead scoring generate $112,000 in attributed closed revenue. ROI comes out to 300%. Build this in a simple spreadsheet with three tabs: cost inputs, revenue attribution, and a rolling monthly ROI trend, so you can catch a slowdown before it becomes a quarterly surprise.
Which Metrics Actually Feed Your ROI Number?
ROI is a lagging output. The metrics below are what actually move it, and most of them show up weeks before revenue does.
- Conversion rate lift for a specific workflow, measured by comparing conversion rates before and after automation on the same segment.
- Customer lifetime value (CLV), which automation increases through consistent nurture cadences and win-back sequences that manual outreach rarely sustains.
- Customer acquisition cost (CAC), which V12 AI’s survey found dropped a median 31% among companies running mature automation programs.
- Lead quality and lead-to-customer conversion rate, which you value by multiplying the conversion delta by average deal size.
- Time saved, converted into dollars by multiplying hours reclaimed by loaded hourly cost. IBM’s research on automation productivity gains points to measurable overhead reduction that belongs in this calculation, not left out as a soft benefit.
- Engagement metrics like open rate, click rate, and workflow completion rate, which function as early warning signals rather than final proof.
Statistic Callout: The 2026 V12 AI survey found companies also reported a median revenue increase of 14.5% and a median time savings of roughly 6.3 hours per week once automation matured past the initial setup phase.
Track these weekly. A CAC that stops falling, or an engagement rate that flattens, tells you something is breaking two months before the ROI report does.
How Do You Avoid Overstating Automation’s Impact?
Last-click attribution and most multi-touch models systematically overcount automation’s contribution, because they credit the channel that happened to be present at conversion rather than the channel that caused it. Zogby’s calculator guidance warns that naive attribution typically inflates impact by 20% to 50%, which means a reported 400% ROI could genuinely be closer to 250% once you strip out revenue that would have arrived anyway.
The fix is incrementality testing. Here’s how to run it:
- Split a comparable audience into a treatment group (receives the automated sequence) and a holdout group (does not).
- Run both groups long enough to reach a meaningful sample, typically one full sales cycle.
- Compare conversion and revenue between groups. The gap is your incremental lift, not the total revenue the treatment group generated.
- Report the adjusted number to finance with a conservative range rather than a single inflated figure.
When a true holdout isn’t feasible, matched cohorts, propensity-score matching, or uplift modeling get you a credible estimate without withholding revenue-generating tactics from anyone.
Pro Tip: Present two numbers to finance: the raw attributed ROI and the incrementality-adjusted ROI. Showing both builds more credibility than showing either alone, because it signals you already accounted for the skeptical question before someone asks it.
What Should You Monitor Between ROI Reports?
Quarterly ROI reviews are too slow to catch a program going sideways. Track these weekly or biweekly instead:
- Workflow throughput: how many contacts move through each automated sequence per week.
- Funnel leak rate: the percentage dropping out at each stage compared to your baseline.
- Deliverability rate: inbox placement, since a drop here silently erodes every downstream metric.
- Time saved per team member, tracked against the labor-cost input in your ROI formula.
Translate these into projected revenue by applying your historical funnel conversion rates to current volume. Set alert thresholds, such as a 10-point deliverability drop or a 20% throughput dip, that trigger a same-week review rather than waiting for the next scheduled report.
What Actually Moves Marketing Automation ROI Higher?
Platform choice matters less than most vendors want you to believe. V12 AI’s 2026 analysis found that top-performing companies out-executed competitors on the same tools far more often than they out-spent them on better software.
- Fix your data foundation first. A single source of truth across CRM and email eliminates the duplicate and stale records that quietly tank every conversion metric above.
- Design workflows that preserve context. A lead who downloaded a pricing guide should never get the same generic nurture as one who just subscribed to a newsletter.
- Personalize with dynamic content. Segment-specific subject lines and content blocks consistently outperform static blasts, and the lift shows up directly in your conversion rate metric.
- Use AI to accelerate setup, not replace judgment. AI-assisted implementations are cutting configuration time significantly in 2026, but every generated workflow still needs a human quality check before launch. Forefront Industries applies AI automation this way, using it to speed configuration while custom logic still gets built and reviewed by engineers.
- Tighten sales handoff and lead routing. A lead that sits unclaimed for six hours converts at a fraction of the rate of one routed instantly.
- Run a small, continuous testing cadence. One subject line test and one workflow-timing test per month compounds into meaningfully better numbers by quarter’s end.
Pro Tip: Start your testing playbook with send-time optimization before you touch copy. It’s the cheapest test to run and often produces the fastest measurable lift in open rate, which cascades through every downstream metric.
What ROI Benchmarks Should You Expect and When?
Budget for four cost buckets in year one: software licensing, setup and integration labor, creative production, and any agency or consulting fees. These vary widely by company size, but skipping any one of them is the single most common way teams understate true cost.
- Nucleus Research’s benchmark of $5.44 returned per $1 spent reflects a three-year window, not a first-quarter result.
- The 2026 survey of 487 companies found a median first-year ROI of 300% to 400%, with 73% reporting positive ROI within 90 days, a notably faster time-to-value than earlier automation cycles.
Statistic Callout: Nearly three in four companies in that same 2026 survey hit positive ROI inside their first quarter, a shift driven largely by faster, AI-assisted implementation timelines.
Build three scenarios for finance: conservative (low conversion uplift, slow adoption), expected (matches median benchmarks), and aggressive (assumes top-quartile execution). Payback typically shortens when you fix data quality before launch rather than after.
Why Do Automation Programs Underperform?
Run this diagnostic when ROI falls short of the benchmarks above:
- Are you reporting emails sent and workflows triggered instead of incremental revenue? That’s the vanity-metrics trap.
- Is customer data split across disconnected systems with no single source of truth?
- Did you skip incrementality testing entirely and take attributed revenue at face value?
- Are workflows launched without a human quality pass on logic and content?
- Is lead routing slow enough that sales loses the moment of intent?
- Are you testing anything on a monthly cadence, or did testing stop after launch?
- Does your CAC or conversion trend show a flat line for two consecutive months?
Two or more “yes” answers point to implementation quality, not platform capability, as your real problem.
Does Custom Implementation Actually Change the Numbers?
Forefront Industries builds custom CRM and lifecycle email systems on platforms like Salesforce Marketing Cloud and Braze, engineering the lifecycle automation that connects workflow logic directly to clean CRM data. Buyers evaluating a managed implementation should ask for baseline metrics, a defined measurement window, and a data-integration audit before signing.
A Straight Take On Automation ROI
The industry oversells platform features and undersells execution. Two companies running the identical tool can land 90 days apart in profitability, and the gap almost always traces back to data quality and testing discipline, not software choice. If you lead a marketing team, do three things now: assign explicit ownership of your CRM data hygiene, fund one small holdout test this quarter even if it feels like leaving revenue on the table, and set a cross-functional service-level agreement with sales on lead response time.
- Jeremy
Get a Faster Path to Measurable ROI
Building and proving automation ROI in-house takes months of data cleanup, integration work, and testing infrastructure most marketing teams don’t have time to build from scratch. A managed alternative exists offering custom-engineered CRM and email systems built on enterprise platforms, designed so lead quality and conversion data are clean and measurable from day one instead of retrofitted later.
If your current setup makes it hard to even calculate a trustworthy ROI number, that’s usually a data-architecture problem, not a reporting problem. Forefront Industries’ AI automation work and custom CRM and email engineering are built to fix that foundation while cutting the time it takes to see results. Request a scoped audit or a costed pilot estimate through Forefront Industries’ services page to see what a properly measured automation program could return for your team.
Sources
- Marketing automation returns $5.44 for every dollar spent - Nucleus Research (v61)
- Marketing automation ROI in 2026: Real numbers from 487 companies - V12 AI
- Free Marketing ROI Calculator (2026) | Zogby
- AI and marketing automation benefits - IBM
FAQ
How Long Does It Take to See ROI From Marketing Automation?
About three-quarters of companies surveyed in 2026 reported positive ROI within 90 days, largely due to faster AI-assisted setup, though full payback against total first-year cost often takes longer.
What’s the Difference Between ROI and ROAS?
ROI measures net return against total program cost, including labor and software, while ROAS measures revenue against media spend alone and ignores overhead.
How Do You Measure Incremental ROI Instead of Attributed ROI?
Run a holdout test comparing a treatment group against a comparable group that doesn’t receive the automated sequence, then treat the revenue gap between them as your true incremental lift.
Can a Custom-Built CRM System Improve Automation ROI?
Yes. Clean, integrated CRM data removes the duplicate records and broken segmentation that distort conversion metrics, which is why Forefront Industries’ custom-engineered systems are built around a single source of truth from the start.