Enforce Website Performance Budgets with 3–5 Metrics in CI for Devs

A performance budget is a measurable, enforceable limit on a site’s speed and resource metrics, defined by a metric, a numeric threshold, a percentile, and a consequence. Its job is to stop regressions before they ship. Teams adopting one should start small: pick three to five metrics, assign warning and error thresholds, and wire the checks into the build pipeline.
TL;DR:
- Performance budgets should include both user-centric metrics like Core Web Vitals and quantity metrics such as total JavaScript weight or number of requests to provide a complete view of site speed.
- Setting thresholds based on the 75th percentile (p75) reflects real user performance, and targets should be at least 20% better than comparable sites to maximize perceived speed benefits.
- Integrating budget checks into CI/CD pipelines with tools like Lighthouse CI or WebPageTest ensures automatic enforcement and prevents regressions before deployment.
- Monitoring should combine synthetic tests with real-user data to accurately reflect genuine user experiences, with p75 serving as the standard measurement point for Core Web Vitals.
- Budget exceptions must be justified with documented reasons and risk assessments, and budgets should be re-evaluated quarterly to adapt to changing device, network conditions, and business priorities.
Table of Contents
- Why performance budgets matter for product and engineering teams
- What a performance budget looks like: metrics, thresholds, and the four required components
- How to choose metrics and set thresholds for your site
- Implementing budgets in engineering workflows (CI/CD, pull requests, and alerts)
- Monitoring and validating budgets: synthetic testing and real-user monitoring
- Practical rules and examples: sample budgets, asset limits, and mapping size to time
- Forefront Industries, practitioner notes and operational patterns
- When to prioritize budget enforcement and when to allow exceptions
- How Forefront Industries helps: services mapped to budget needs
- Sources
- FAQ
Why performance budgets matter for product and engineering teams
Page speed affects conversion and retention directly, and mobile traffic makes the stakes higher since constrained networks and devices expose every extra kilobyte. Without a budget, performance degrades gradually. Each feature adds a script, an image, a font, and no single commit looks like the problem. The site arrives at a crawl through a hundred small decisions, none of which got flagged.
A budget changes that. It forces trade-offs at design time rather than after launch, turning “can we add this carousel” into “what do we remove to keep it.”
Budgets also only work when they stop being one engineer’s pet rule and become a team agreement. Performance budgets 101 frames a good budget as a cross-disciplinary agreement, treated with the same weight as accessibility or brand guidelines during design review, not bolted on afterward.
That buy-in matters because:
- Designers need to know the image and font budget before they finalize mockups.
- Product managers need to see performance as a constraint alongside scope and timeline.
- Engineers need a shared reference point instead of ad hoc opinions during code review.
Once a budget has cross-functional ownership, failing a check reads as “we agreed to this,” not “the performance person is blocking my PR.”
What a performance budget looks like: metrics, thresholds, and the four required components
A performance budget needs two kinds of metrics. User-centric metrics measure what people experience: Core Web Vitals like Largest Contentful Paint (LCP), Interaction to Next Paint (INP), and Cumulative Layout Shift (CLS). Quantity and rule-based metrics measure what causes that experience: total JavaScript weight, number of HTTP requests, image dimensions, and font loading rules.
A budget that only tracks one or the other misses half the picture. Quantity metrics catch problems early, before a page ever loads in a browser. User-centric metrics confirm the quantity limits are actually producing a fast experience.
According to MDN, a functional budget requires four components:
- A metric (what you’re measuring, such as LCP or total image weight).
- A numeric threshold (the limit that defines pass or fail).
- A percentile (commonly p75, meaning 75% of page loads meet the threshold).
- A consequence (a warning, a failed build, or a blocked deployment).
Drop any one of those four and the budget becomes an aspirational guideline instead of an enforceable rule.
Default thresholds give teams a starting point instead of guessing. Web.dev’s definition of Core Web Vitals thresholds sets the “good” bar at p75 for LCP at 2.5 seconds or less, INP at 200 milliseconds or less, and CLS at 0.1 or less.
These numbers exist because Google evaluates them at the 75th percentile across real device and network conditions, which filters out best-case lab results and reflects what most visitors actually encounter.
How to choose metrics and set thresholds for your site
Generic thresholds are a starting point, not a finished budget. Setting one that fits your actual site takes a few deliberate steps.
- Identify key user journeys and representative page templates. A home page, a product or service page, and a conversion page (checkout, signup, contact) usually cover the traffic that matters most.
- Gather a baseline from both synthetic and real-user data. Run Lighthouse or WebPageTest against each template, then pull field data from the Chrome User Experience Report (CrUX) or your own RUM tool to see what real visitors experience.
- Use RUM data to pick your percentile cutoff, typically p75, and use synthetic tools to catch edge cases that field data smooths over, like a slow third-party script that only triggers for a subset of sessions.
- Apply the 20% rule for competitive positioning. Web.dev recommends targeting a site at least 20% faster than the strongest comparable site, since that margin is what users perceive as noticeably quicker.
- Set two tiers: warning and error. A warning flags a regression for review; an error blocks the build. Document why each threshold was chosen so the next engineer isn’t reverse-engineering intent six months later.
Pro Tip: Never set your error threshold to match your current performance. Set it to the “good” target you want to reach, and use the warning tier to manage the gap as technical debt.
Implementing budgets in engineering workflows (CI/CD, pull requests, and alerts)
A budget that lives in a spreadsheet gets ignored. A budget wired into the pipeline gets enforced automatically, which is the only version that survives a deadline crunch.
- Lighthouse CI runs Lighthouse audits against pull requests and fails the build when a defined metric crosses its threshold.
- WebPageTest scripts can run scheduled synthetic tests against staging or production and alert on regression.
- Sitespeed.io offers similar scripted testing, often favored for self-hosted or multi-page monitoring setups.
- Webpack performance hints and tools like bundlesize catch bundle-size regressions at build time, before a page ever renders.
The harder decision is whether a failed check should block a merge or just warn. A hard-fail gate stops a regression from shipping, but it can also stall a release over a marginal, explainable change. A warning-only gate keeps velocity up but relies on someone actually reading the warning. Many teams resolve this by tying warnings to a ticket automatically, so a flagged regression gets triaged even if it doesn’t block the merge outright.
A practical sequence looks like this: a local dev check (via a pre-commit hook or local Lighthouse run) catches obvious issues before code is even pushed. A PR check runs Lighthouse CI against the proposed change. A staging synthetic run via WebPageTest or Sitespeed.io validates the build under more realistic network conditions. Finally, production RUM data confirms the change performs as expected once real traffic hits it, closing the loop between what was tested and what actually happened.
Monitoring and validating budgets: synthetic testing and real-user monitoring
Synthetic testing and real-user monitoring answer different questions, and a mature budget process uses both.
Lighthouse and WebPageTest run controlled, repeatable tests under fixed conditions, which makes them ideal for catching regressions before deployment and for debugging a specific failure. CrUX and other RUM tools capture what actually happened across real devices, networks, and locations, which makes them the source of truth for whether a budget reflects genuine user experience.
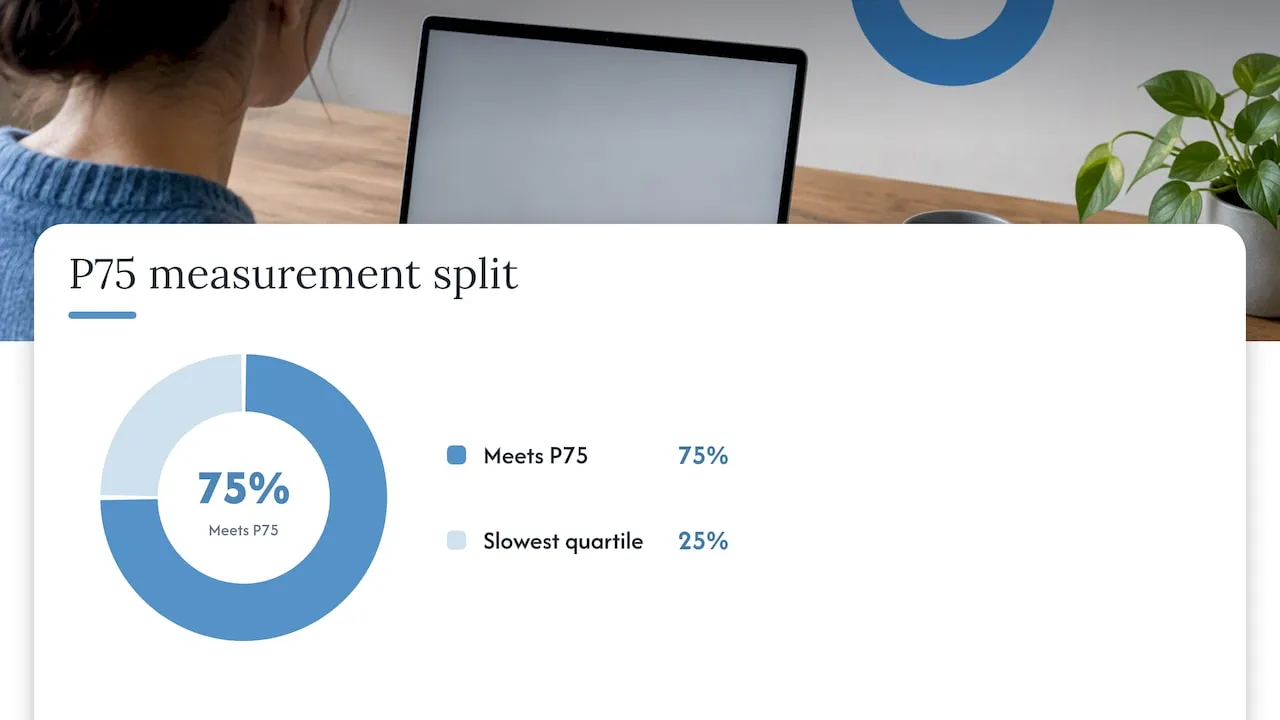
P75 is the standard measurement point for Core Web Vitals because it represents a demanding but achievable bar: three out of four page loads meet it, while the slowest quarter, often skewed by weak connections or old devices, doesn’t drag the whole metric down artificially. MDN recommends measuring budgets at p75 for exactly this reason.
Sample size matters too. A RUM sample that’s too small on a low-traffic page can swing wildly month to month, making a real regression indistinguishable from noise.
A few techniques cut down on false positives:
- Filter out third-party script failures that are outside your control, like an ad network timing out, from your own first-party budget.
- Exclude bot traffic and prerendered pages, which skew timing data without reflecting real visitors.
- Compare like-for-like page templates rather than aggregating a product page’s budget with a blog post’s.
- Set a minimum sample size before treating a percentile shift as meaningful.
Practical rules and examples: sample budgets, asset limits, and mapping size to time
Numbers make budgets concrete. A home page, a product page, and an article page each carry different risk profiles, so their budgets should differ too.
A reasonable starting point:
- Home page: LCP ≤ 2.5s at p75, total JavaScript ≤ 300 KB, images ≤ 500 KB combined.
- Product page: LCP ≤ 2.5s at p75, CLS ≤ 0.1, hero image ≤ 150 KB.
- Article page: LCP ≤ 2.5s at p75, total page weight ≤ 1,600 KB, since Lighthouse flags pages with excessive network payload and HTTP Archive data points to that figure as a sensible ceiling for mobile-friendly load times.
Critical-path resources, the CSS and JavaScript required before a page can render anything useful, deserve their own tighter cap: Lighthouse guidance points to keeping that figure near 170 KB, since anything larger delays first paint noticeably on a slow mobile connection.
Per-asset defaults that tend to hold up across most sites:
- Images: compressed and served in a modern format, individually under 200 KB unless it’s a dominant hero element.
- Fonts: no more than two font families, subset to the characters actually used, loaded with
font-display: swap. - JavaScript: third-party scripts audited individually, since a single tag manager or chat widget can quietly consume a quarter of the entire budget.
A short checklist for PR reviewers: does this feature add a new asset type, does it push any page over its declared threshold, and if it does, is there a documented, time-boxed exception attached to the PR.
Forefront Industries, practitioner notes and operational patterns
Custom-built sites include performance budgets directly in acceptance criteria, so a feature isn’t marked done until it passes its declared thresholds in CI, not just in design review.
For managed clients, monitoring and alerting are tied to a remediation path rather than a passive dashboard: when a page regresses past its error threshold, it triggers a ticket with an expected response window instead of sitting unnoticed in a report. Budgets are revisited on a quarterly cadence, consistent with the practice of treating thresholds as dynamic rather than fixed forever.
This approach draws on background building CRM and lifecycle marketing systems for enterprise clients, where a regression in page speed translates directly into lost leads, not just a lower score in a testing tool. Custom-coded builds, rather than templated ones, give that monitoring a direct line into the actual codebase instead of a third-party theme layer.
When to prioritize budget enforcement and when to allow exceptions
A budget earns trust by holding firm, which means exceptions should be rare and justified, never routine. A legitimate exception has measured business value behind it, like an experiment showing a heavier page element lifts conversion enough to offset the speed cost.
Every exception needs three things attached: a documented reason, a risk assessment of what the regression affects, and a revert plan if the trade-off doesn’t pan out as expected.
Budgets themselves aren’t permanent fixtures. Revisit them on a quarterly cycle, since what counted as “good” performance, or an acceptable risk, shifts as devices, networks, and business priorities change.
- Jeremy
How Forefront Industries helps: services mapped to budget needs
Setting a performance budget is one thing. Keeping it enforced months after launch, through redesigns, new integrations, and staff turnover, is where most teams lose the thread. Forefront Industries builds budget enforcement into the engineering itself: custom-coded sites with CI checks wired in from day one, not a template with performance bolted on after the fact.

Website Maintenance and Performance Plus plans cover ongoing monitoring, alerting, and remediation once a site is live, while the underlying custom build (rather than a page builder) gives that monitoring something precise to measure against. For teams that want the infrastructure and the governance together, Forefront’s website maintenance services outline how monitoring and performance plans are structured, and the full services overview covers custom development and CRM engineering for teams building from scratch.
Sources
A few primary sources cover the thresholds and tooling referenced throughout this guide:
- Avoid enormous network payloads | Lighthouse | Chrome for Developers
- Performance budgets - MDN Web Docs
FAQ
How can I measure my website performance?
Use a synthetic tool like Lighthouse or WebPageTest to test specific pages under controlled conditions, and pair it with real-user monitoring or CrUX data to see what actual visitors experience. Measuring both catches issues a single method misses, since synthetic tests validate changes before launch and real-user data confirms the field impact.
What is a performance budget?
A performance budget is a measurable limit on a site’s speed or resource metrics, made enforceable through four components: a metric, a numeric threshold, a percentile (commonly p75), and a consequence like a warning or a blocked deployment, according to MDN. Without all four pieces, it functions as a guideline rather than a rule teams actually follow.
What are the top 3 website performance metrics to monitor?
The three Core Web Vitals form the core set: Largest Contentful Paint at 2.5 seconds or less, Interaction to Next Paint at 200 milliseconds or less, and Cumulative Layout Shift at 0.1 or less, all measured at the 75th percentile. These three track loading speed, responsiveness, and visual stability, the three dimensions that shape how fast a page actually feels.
What are the 7 types of budgets?
Performance budgets are commonly grouped into a few core categories rather than a fixed list of seven: timing-based (like LCP or Time to Interactive), quantity-based (like total request count or image weight), and rule-based (like a Lighthouse score threshold), as described by MDN. Definitions of additional subcategories vary by source, so most teams build their budget from these three core types rather than chasing a specific count.