Predictive Lead Scoring for B2B Sales: Cut Rep Hours, Route by Revenue

Predictive lead scoring uses machine learning to rank leads by conversion probability, so sales teams work the highest-value prospects first. The payoff is operational: higher conversion per rep-hour and less time wasted on cold records. Modern systems go further than a raw score. They return a calibrated probability plus a short explanation, so reps know not just who to call, but why.
TL;DR:
- Calibrated probabilities allow sales teams to prioritize leads based on expected revenue rather than raw scores, improving decision-making.
- Models must be trained only on signals available at the lead entry point to avoid data leakage and ensure real-world reliability.
- Regular monitoring of model performance and feature distribution helps detect market shifts and maintain scoring accuracy over time.
- Integrating scoring into CRM workflows with clear fallback rules and explainability features enhances operational discipline and lead conversion.
Table of Contents
- What predictive lead scoring is and why it matters
- How predictive scoring works: data inputs and feature engineering
- Model choices and performance: what actually works
- From raw scores to calibrated probabilities
- Explainability: surfacing reasons behind a score
- Implementation checklist for production rollout
- Monitoring, drift detection, and governance
- Measuring impact: KPIs and ROI
- Field notes on integrating scoring into CRM workflows
- Where accuracy ends and operational discipline begins
- Resources worth a closer look
- Put predictive scoring to work in your CRM
- Sources
- FAQ
What predictive lead scoring is and why it matters
Traditional point-based scoring assigns fixed values to actions: five points for a demo request, two for an email open. It is easy to build and easy to game, and it treats every signal as equally important regardless of what actually predicts a closed deal. Predictive lead scoring replaces that guesswork with a model trained on historical outcomes, weighting signals by what they actually predicted in the past.
The objectives stay the same across both approaches, but the execution changes:
- Prioritize which leads get immediate outreach versus nurture sequences.
- Route leads to the right rep or team based on fit and intent.
- Match sales resources to the accounts most likely to convert.
Teams that adopt predictive models typically see a lift in conversion rate and a measurable drop in hours spent on leads that were never going to close. The model does not replace sales judgment, it narrows the field before judgment gets applied.
How predictive scoring works: data inputs and feature engineering
A model is only as good as the signals it trains on. Most B2B scoring systems draw from four categories: behavioral data (page views, demo requests, content downloads), engagement data (email opens and clicks), firmographic data (company size, industry, revenue band), and historical interaction data (past deals, support tickets, lead source). Across public demos, engagement depth, email engagement, company fit, days since first touch, and intent signals like visits to pricing or demo pages repeatedly rank as the highest-importance predictors of conversion.
Turning raw events into usable features takes deliberate engineering work:
- Apply rolling windows (7-day, 30-day, 90-day activity counts) instead of lifetime totals, since recent behavior predicts better than cumulative behavior.
- Use decay weights so a demo request from last week counts more than one from six months ago.
- Build interaction features, such as company size combined with page-view velocity, that capture patterns a single variable misses.
- Encode categorical fields like industry or lead source consistently, using the same mapping at training and inference time.
- Deduplicate records and add timestamp features so the model can learn seasonality without learning noise.
The biggest hygiene risk is training on signals that would not have existed at the moment a lead entered the pipeline. That kind of leakage inflates test accuracy and collapses in production.
Model choices and performance: what actually works
Ensemble tree methods are the practical default for B2B scoring. A 2025 study comparing 15 classifiers found that Gradient Boosting Classifier and LightGBM were among the top performers, with Gradient Boosting reaching the highest marks in the comparison.
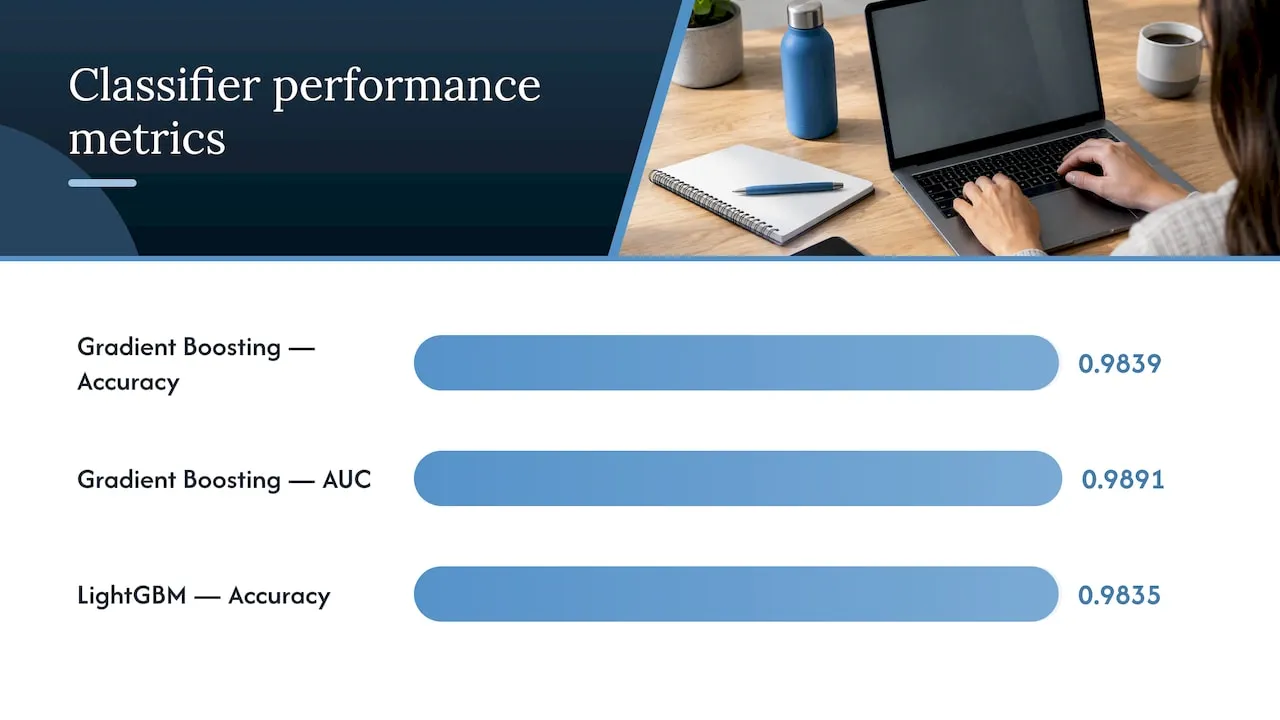
Gradient Boosting hit 0.9839 accuracy and 0.9891 AUC in that comparison of 15 classification algorithms, with LightGBM close behind at 0.9835 accuracy and better computational efficiency, making it a strong choice when retraining speed matters.
Logistic regression still earns a place in most stacks:
- It trains fast and serves as an interpretable baseline against which to measure ensemble gains.
- Its coefficients map directly to feature impact, which simplifies early explainability work.
- It has lower compute cost at inference time, useful for high-volume, low-latency scoring.
Ensemble methods cost more to train and are harder to explain directly, which is why pairing them with a separate explainability layer matters more than chasing marginal accuracy gains. AutoML tools and neural networks are worth testing only once a team has outgrown tree-based models on a well-labeled dataset, not before.
From raw scores to calibrated probabilities
A raw model score, say 0.82, means little to a sales rep unless it reflects an actual probability of conversion. Calibration adjusts a model’s output so that a 0.82 score really does correspond to roughly an 82% chance of conversion, not an arbitrary ranking number.
Two methods cover most cases. Platt scaling fits a logistic curve to the model’s outputs and works well with smaller datasets and models that are already close to well-calibrated. Isotonic regression is more flexible and fits larger datasets better, but it needs more data to avoid overfitting the calibration curve itself.
Calibrated probabilities unlock expected-value routing: multiply probability by deal size to rank leads by expected revenue, not just likelihood, and set SLA thresholds (follow up within one hour above a given probability) based on real numbers instead of an arbitrary score cutoff.
Explainability: surfacing reasons behind a score
A score without a reason invites blind trust or blind rejection, neither of which helps a rep. SHAP values or a simple top-feature list show which inputs pushed a lead’s score up or down, and that detail changes how reps act on the number.
Effective interfaces tend to share a pattern:
- Show the top three positive and negative contributors to the score.
- Add a trend arrow showing whether the score rose or fell over the past week.
- Include a short “what to do next” suggestion tied to the dominant factor.
Pro Tip: Pair every score with its top reason in the CRM record view, not in a separate dashboard reps have to open.
Explanations trace the model’s own logic, not ground truth, so a feature that looks predictive may actually be a proxy for something the team would not want to score on, such as a ZIP code standing in for income. Review top features regularly for that risk.
Implementation checklist for production rollout
Getting a model into daily use takes more than good accuracy numbers. A practical rollout sequence:
- Define the conversion label precisely, including the conversion window, and keep that definition consistent across every training run.
- Confirm a minimum sample size per segment before trusting segment-level scores, since sparse segments produce unstable predictions.
- Train only on signals available at the moment a lead entered the funnel, holding out a true test set and a separate validation set for tuning.
- Optimize for a revenue-weighted business objective rather than a generic metric alone. An EvalML demo found that optimizing for a lead-scoring objective built around the monetary value of true and false positives produced substantially more revenue per lead than optimizing for AUC alone in that demo’s parameters.
- Decide between batch scoring (overnight refresh) and real-time scoring (API call on each new event), then map score bands to specific workflows and SLAs.
- Set fallback rules for when scoring fails or data feeds break, so leads still route somewhere sensible.
- Stand up the serving layer: an API endpoint, defined latency targets, a feature store shared between training and inference, authentication, and monitoring hooks on every call.
Monitoring, drift detection, and governance
A model that performs well at launch degrades as markets, campaigns, and buyer behavior shift. Monthly checks on population and feature distributions catch that drift before it shows up as a sales complaint.
A practical governance cadence for managed IT providers in Massachusetts includes:
- Monthly drift and performance monitoring, with a sample of recent labels revalidated against outcomes.
- Quarterly bias audits checking whether performance diverges across protected or sensitive groups, with remediation steps defined in advance.
- A documented kill switch that pauses automated scoring the moment an upstream data source changes or breaks.
Pro Tip: Write the kill-switch runbook before launch, not after the first bad week of scores.
Operational failures, such as a routing fallback nobody tested or a lead source quietly dropping to zero conversions, cause more damage in practice than any modeling choice.
Measuring impact: KPIs and ROI
The test of a scoring model is whether it changes sales outcomes, not whether it posts a strong AUC in a notebook. Core KPIs to track: lift in conversion rate among top-scored leads, the share of eventual conversions captured in the top decile of scores, hours of rep time no longer spent on low-probability leads, and any shift in customer acquisition cost.
An A/B test with a holdout group, leads scored but routed by the old process, isolates the model’s actual effect rather than crediting it with gains from an unrelated campaign. Run it long enough to reach a sample size that can detect the lift reliably, then translate the result into expected revenue and rep-hours saved to make the business case concrete.
Field notes on integrating scoring into CRM workflows
Some agencies build this kind of scoring directly into custom CRM and lifecycle systems, mapping score bands to existing lead-routing rules rather than replacing them. Migrating legacy systems without losing historical lead data is usually the harder half of the project.
Where accuracy ends and operational discipline begins
The models in this guide all perform well on paper. What separates a scoring system that sticks from one that gets quietly ignored by six months in is operational discipline: tight SLA rules, a working kill switch, and someone accountable for monthly drift checks.
Chasing the last few points of AUC rarely moves revenue as much as fixing a broken fallback rule does. Start with a small pilot, measure the actual lift, and only then scale the model across the full pipeline.
- Jeremy
Resources worth a closer look
For deeper technical grounding, see the Frontiers study on classifier performance, the PRISM two-stage profiling paper, and the EvalML lead-scoring demo.
Put predictive scoring to work in your CRM
Some companies build enterprise-grade CRM and lifecycle systems with lead routing and workflow automation engineered around each client’s actual sales process, not a generic template. For teams that already have a scoring model but lack the engineering to wire it into daily workflows, the gap is usually integration, not math.
That work sits inside Forefront’s Email & CRM Development and AI Automation & Consulting services, where scoring logic gets mapped into CRM fields, routing rules, and rep-facing views that match how your team actually sells. For ongoing upkeep once scoring is live, including maintenance of the integrations and data feeds that keep it accurate, the Webmaster and Performance Plus plans cover the operational side. Reach out through Forefront’s service pages to scope what a CRM-integrated scoring system would take for your pipeline.
Sources
- The relevance of lead prioritization: a B2B lead scoring model based on machine learning - Frontiers in Artificial Intelligence
- Profiling before scoring: a two-stage predictive model for B2B lead prioritization
FAQ
What is predictive lead scoring in simple terms?
Predictive lead scoring is a machine learning model that ranks leads by their estimated probability of converting, based on patterns in past deals. It replaces fixed point values with weights learned from actual outcomes, which tends to produce more accurate prioritization.
How much data do I need to build a predictive scoring model?
The exact minimum depends on the number of segments and features a team wants to score on, and sparse segments need more records before their scores are reliable. Teams with limited historical data can also use a two-stage approach like PRISM, which clusters leads first and demonstrated meaningful conversion gains in tested service-industry datasets.
How often should a lead scoring model be retrained?
Most teams review performance and feature drift monthly and retrain when distributions shift meaningfully rather than on a rigid fixed schedule. A documented kill switch should also exist to pause scoring immediately if an upstream data source changes.
Should sales reps see the raw score or the probability?
Reps generally act faster and trust the system more when they see a calibrated probability alongside the top reasons behind it, rather than an unexplained raw number. Explanation methods like SHAP make it possible to show the top positive and negative factors behind each score directly in the CRM.
Which algorithm should I start with for lead scoring?
Gradient Boosting and LightGBM are strong starting points, with Gradient Boosting reaching 0.9839 accuracy and 0.9891 AUC in a 2025 comparison of 15 classifiers. Logistic regression remains useful as a fast, interpretable baseline to compare against before committing to a heavier model.